
Dairy wastewater frequently contains high levels of the complex protein casein, a milk solid with unique properties which make it difficult to breakdown. When enough casein is undegraded, it can lead to problems with poor settling, foaming, a cloudy effluent, and unnecessary plant expansion. Furthermore, undegraded casein does not release free amino acids, which aid in essential floc formation. Qwik Zyme P is a biocatalyst designed to initiate the hydrolysis of casein into a form consumable by bacteria.
Qwik-Zyme P Studies
The following shows the ability of Qwik-Zyme P to assist in the degradation of dairy proteins. Degree of hydrolysis testing is a direct measurement of the degradation of proteins with Qwik-Zyme P, and the oxygen uptake studies demonstrate how this will influence wastewater plant efficiency. We performed analysis on samples of whey protein isolate, as well as several dairy wastewater samples. Qwik-Zyme P was applied at 10 ppm in all the following studies. The testing showed an 88% improvement in protein breakdown versus control in the hydrolysis, while both lab and field samples used in oxygen uptake testing presented increased rates of degradation.
What is Degree of Hydrolysis Testing?
Degree of hydrolysis testing measures the proportion of peptides (amino acids) present verses complex proteins in a sample. A higher degree of hydrolysis indicates more degradation. This shows the effects Qwik-Zyme P has on the degradation of dairy protein, in this case whey protein isolate.
Degree of Hydrolysis Testing: Results
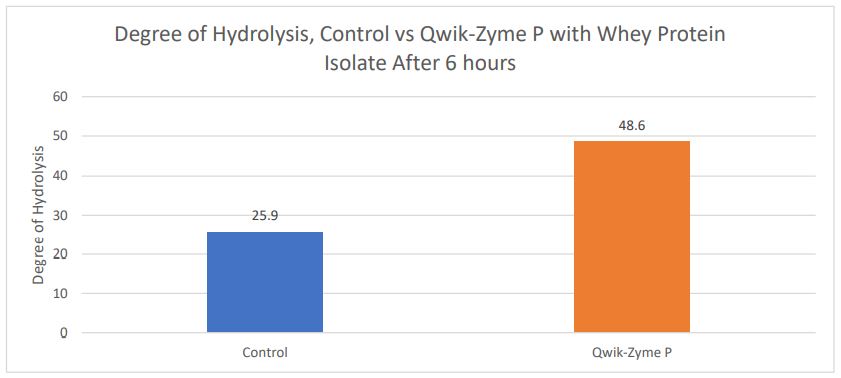
Figure 1. The figure above represents the degree of protein hydrolysis after a 6-hour digestion of whey protein isolate. 10 ppm Qwik-Zyme P was compared to a control with no product added. In this case, we observed 88% improvement in protein breakdown verses the control.
While degree of hydrolysis is a reliable method for analyzing biocatalyst efficacy, it does not capture the larger picture of how a biocatalyst will impact a wastewater system. For a more direct representation of this impact, we have included oxygen uptake analysis for Qwik-Zyme P versus the control, using both whey protein and field samples from dairy plants.
What is Oxygen Uptake Testing?
What is Oxygen Uptake Testing? Oxygen uptake analysis is designed to show how Qwik-Zyme P impacts the rate at which bacteria are able to metabolize high levels of proteins. Bacteria remove oxygen at a rate that is proportionate to the rate at which they consume a substrate (such as protein). An increase in oxygen uptake rates shows that bacteria can consume a wastewater sample more quickly. For oxygen uptake analysis, we used wastewater bacteria from our lab mixed liquor. More information on our oxygen uptake analysis is included in the appendix.
Whey Protein Isolate Testing Results
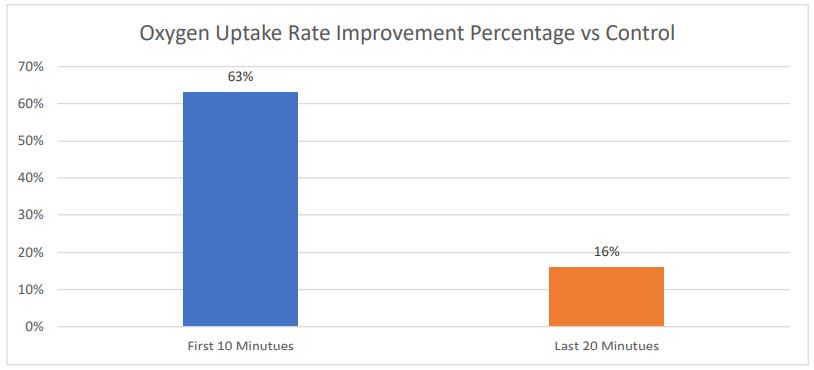
Figure 2. The diagram above shows the increase in oxygen uptake rates with whey protein isolate with the addition of Qwik-Zyme P verses our control. We observed a greater increase in oxygen uptake rate in the first 10 minutes of our testing, compared to the final 20 minutes. This analysis shows the addition of Qwik-Zyme P increased the degradation rates of proteins by 63% for the first 10 minutes of the study, and 16% afterwards.
Overall, we observed that Qwik-Zyme P consistently improved the oxygen uptake rates in our test on whey proteins. An additional observation was that the impacts of Qwik-Zyme P at room temperature were greatest in under 10 minutes of testing, indicating Qwik-Zyme P works rapidly.
What is a Biocatalyst?
In essence, a biocatalyst bridges the gap between a substrate (like protein) and bacteria, giving bacteria the tools they need to consume the substrate. Qwik-Zyme P contains high concentrations of a targeted blend of enzymes and cofactors formulated for rapid hydrolysis of proteins like casein.
Field Samples with Dairy Wastewater
Our field sample analysis includes oxygen uptake results from a mixed cheese and a mozzarella plant. Both plants have high loadings and struggled to fully remove BOD, leading to poor settling and a cloudy effluent. The mixed cheese plant was considering a plant expansion. Both facilities showed improved oxygen uptake rates with the addition of Qwik-Zyme P, indicating faster protein degradation.
Case Study #1, Mixed Cheese Production Plant
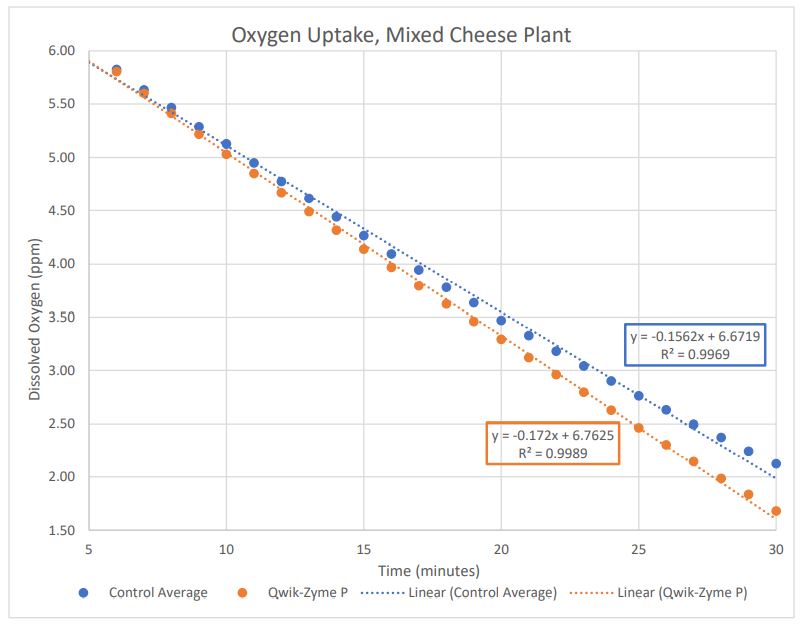
Figure 3. The figure above represents a consistent improvement in oxygen uptake rates with the addition of Qwik-Zyme P. In this case, we observed a 10% increase in the slope of our oxygen uptake graph with Qwik-Zyme P added, relative to the control. This means the casein was digested 10% faster.
In the field, this customer has noticed that adding Qwik-Zyme P into their wastewater process has clarified effluent and enabled them to suspend plans for expansion of their wastewater treatment plant. They discharge into a municipal wastewater system and the cleaner effluent has stopped penalties.
Data is shown after 5 minutes as it tends to be less influenced by setup and is highly variable in this analysis. More information on this is available in the appendix.
Case Study #2, Mozzarella Production Plant
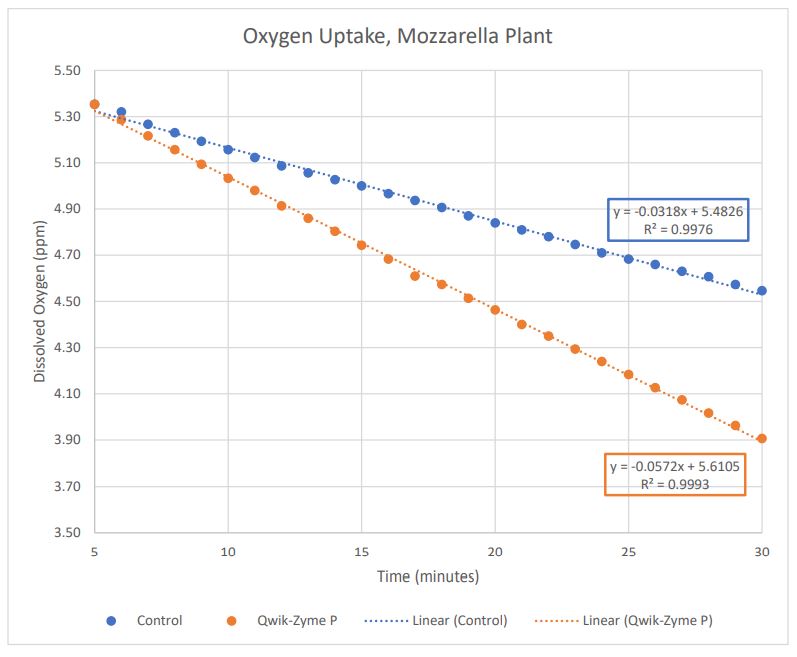
Figure 4. The figure above represents a large increase in oxygen uptake rate with the addition of 10 ppm Qwik-Zyme P. In this case, the magnitude of the slope in our oxygen uptake with Qwik-Zyme P was approximately 80% greater than the control. This represents a major improvement in protein degradation in the wastewater system. It appears to be a case where high concentrations of protein were present in the waste stream, or a case where the bacteria were unable to produce protein-degrading enzymes.
Conclusion
The degradation of proteins in a wastewater system tends to be an inefficient process, and therefore has a lot of potential to be improved by a biocatalyst-based product such as Qwik-Zyme P. Our studies show that Qwik-Zyme P allows increased hydrolysis, or better digestion, of proteins. This increased hydrolysis was shown to lead to increased oxygen uptake rates when wastewater bacteria degrade whey protein isolate. This increase in oxygen uptake rate represents improved bacterial efficiency degrading complex whey proteins. This effect was also observed in customer samples containing cheese production waste which also contain these complex proteins. If you have questions about the use of Qwik-Zyme P in your system, please contact an Aquafix technical representative for consultation, and for potential studies to test the effectiveness of Qwik[1]Zyme P in your wastewater.
Appendix
Qwik-Zyme P Use on the Field
Qwik-Zyme P has been specifically formulated to function effectively in wastewater treatment systems. However, its effectiveness still relies on it being used in appropriate circumstances. The type and concentration of proteins present plays a large role in the effectiveness of Qwik-Zyme P.
pH: Qwik-Zyme P is formulated to function in a wide pH range. Generally, more acidic pH values (below 7) will lead to slow Qwik-Zyme P activity but will enhance Qwik-Zyme P’s stability. Qwik-Zyme P has the best activity between pH 7 and pH 10. pH values above 10 will hinder activity and decrease the stability of the product leading to poor treatment results.
Temperature: Qwik-Zyme P is able to function effectively in a wide range of temperatures. Generally, the lower the temperature, the slower the activity, but also the longer Qwik-Zyme P will persist in a system. Overall, Qwik-Zyme P will work well above 20°C (68°F) in most situations, but higher rate systems will likely experience better results if temperatures are higher. Peak efficiency of Qwik-Zyme P is at 60°C (140°F). If temperatures are expected to be lower than 10°C (50°F), we recommend consulting with a technical representative prior to using Qwik-Zyme P.
Target Substrates: Qwik-Zyme P will work effectively on a wide range of proteins, but its effectiveness may vary depending on the type of protein present. This product has been most extensively testing on whey protein isolate, but we have plans to conduct more extensive testing on a wider range of substrates.
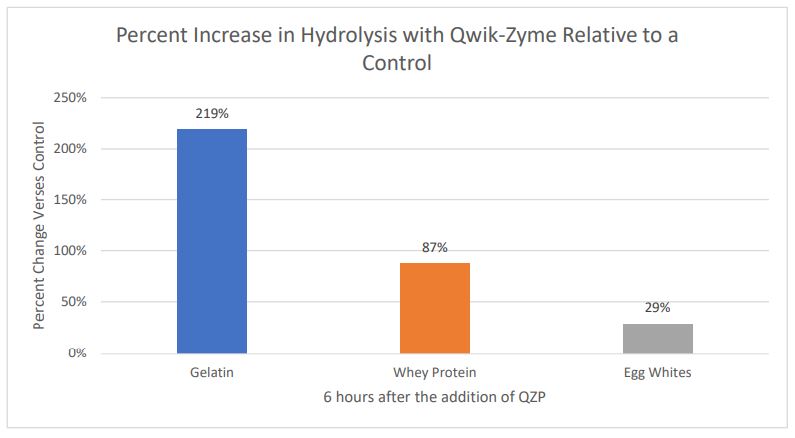
The figure above shows the relative increase in protein hydrolysis with 10 ppm added of Qwik-Zyme P verses a control. We included some additional data on gelatin verses egg whites as a reference on how Qwik-Zyme P can be more or less efficient on different types of protein.
Feel free to contact us with questions about if Qwik-Zyme P is likely to be effective in your system. We also routinely conduct testing analyzing the effectiveness of Qwik-Zyme P on wastewater samples from customers.
Oxygen Uptake Methods
Our oxygen uptake testing was run at room temperature 22⁰C, with a standard substrate COD concentration of 1000 ppm. Wastewater mixed liquor was added in sufficient levels to allow the duration of the oxygen uptake test to be between 30 and 60 minutes. The pH of our test runs was adjusted to be between 7 and 8 and was consistent between samples analyzed. Our oxygen uptake testing was run in 300 mL BOD bottles using the YSI multi-lab 4010-3W and YSI ProOBOD probes. Samples were mixed using magnetic stir plates set to 300 RPM for the duration of the testing. Feel free to contact us for more on how we perform oxygen uptake analysis.
Initially we performed oxygen uptake testing with 50 mL of our lab mixed liquor. We supplemented the COD in our test to 1000 ppm using a non-hydrolyzed whey protein isolate “tera’swhey” (Wisconsin Specialty Protein, Reedsburg Wisconsin). D.O. results were measured every minute for the first 15 minutes of the test, and then after another 15 minutes. Testing was run in triplicate and averaged.
For our field sample analysis, samples of influent and mixed liquor were collected from dairy wastewater systems. We performed oxygen uptake testing on the samples within 2 days of receiving all samples to prevent excessive degradation of our waste substrate. Samples were kept on ice after collection and prior to testing. Substrates were diluted to 1000 ppm COD prior to testing and combined with mixed liquor for analysis. Qwik-Zyme P was applied at a dose rate of 10 ppm prior to testing.
For data analysis, we typically focus on data after 5 minutes of our oxygen uptake analysis. Overall, slopes in our analysis were not highly linear for the first few minutes of testing making the results appear less reliable. Therefore, with our field analysis, we decided to remove the first 5 minutes of data from oxygen uptake test results. This is illustrated in the diagram below.
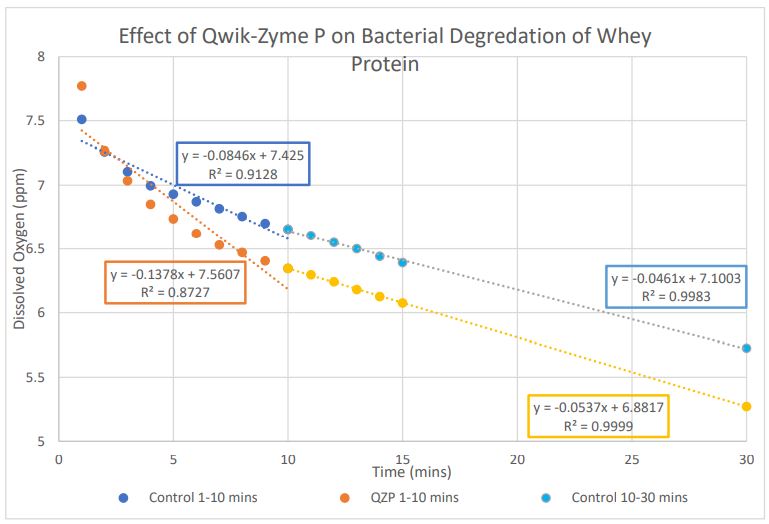
The diagram above shows the oxygen uptake slopes from 0-10 minutes, and 10-30 minutes. The slopes in this diagram represent the rate of bacterial metabolism. We noticed that oxygen uptake rates appeared to be very liner after 10 minutes of degradation (R2 value >0.99 in figure 3).
References
Nielsen, P. M., Peterson, D., & Dambmann, C. (2001). Improved method for determining food protein degree of hydrolysis. Journal of Food Science, 66(5), 642-646. This article provides the specific method we used in our degree of hydrolysis testing. This experiment uses a control with distilled water as a blank, and a serine solution as a standard with 100% hydrolyzed proteins.
Testing and study performed by: Dan McKeaton Chemist, R&D Aquafix, Inc